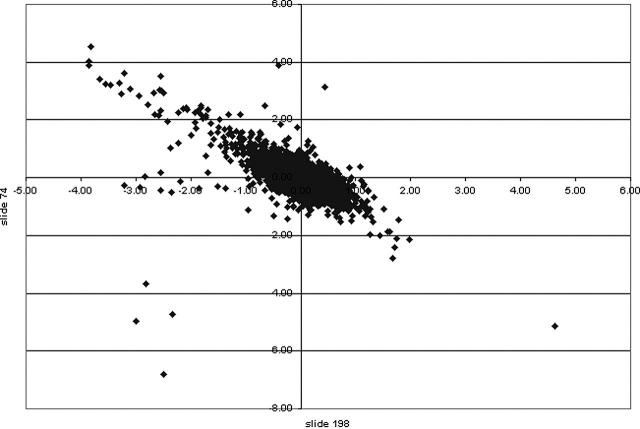
Figure 6.
XY scatter plot of cDNA microarrays. MIGR1 and Sox4 cell lines were compared on a 13.4K mouse oligonucleotide cDNA microarray. Genes of interest indicating up-regulation or down-regulation because of induction were calculated statistically using log base 2. Those with a ratio greater than 1 were considered of interest. An XY scatter plot of 2 independent microarrays (slide 74 and slide 198) showed a linear trend. Those data points at either end indicate those genes of greatest interest in 2 independent experiments. The values on the x- and y-axes indicate the ratio calculated.

