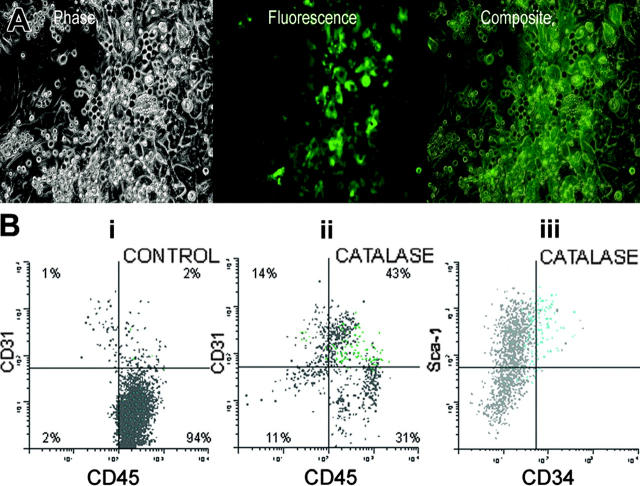
Figure 6.
Tie-2/GFP expression in catalase-treated LTBMCs. (A) Phase and fluorescent photomicrographs of LTBMCs were initiated on irradiated C57Bl/6 stroma, with low-density nonadherent Tie-2/GFP bone marrow cells and cultured for 3 weeks in the presence of catalase. Original magnification, × 200; digital images overlaid using Photoshop (Adobe, San Jose, CA). (B) In each of the figures cells that express the endogenous fluorescence of GFP have been shown as green dots. GFP-negative cells are gray.

