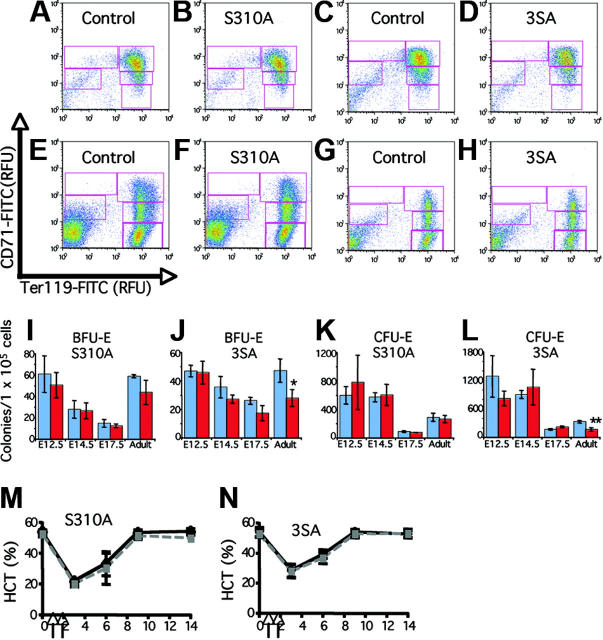
Figure 2.
Analysis of Gata1S310A and Gata13SA fetal and adult hematopoiesis. (A-H) Erythroid differentiation profiles of fetal livers at 14.5 dpc (A-D) and adult bone marrow (E-H) from Gata1S310A and Gata13SA mice, and wild-type controls. Freshly isolated cells were stained simultaneously with FITC-conjugated CD71 and PE-conjugated Ter119. Shown are representative density plots. Relative number of cells in regions R1-R5 (CD71medTer119lo, CD71hiTer119lo, CD71hiTer119hi, CD71medTer119lo, and CD71loTer119hi populations, respectively) were assessed. (I-L) Erythroid progenitor cell numbers in the fetal liver at 12.5, 14.5, and 17.5 dpc and adult bone marrow of wild-type (blue) and knock-in (red) mice. Mean and standard deviation of BFU-E and CFU-E colony numbers per 1 × 10⁵ cells are shown from representative assays performed in triplicate. Statistically significant differences are marked: *P = .05; **P = .001. (M,N) Acute anemia was induced in 12- to 15-week-old mice by the administration of phenylhydrazine (60 mg/kg body weight) on days 1 and 2 (indicated by arrows). Peripheral blood was analyzed prior to administration and on days 3, 6, 9, and 14. Hematocrits (HCT) showing the induction of anemia and recovery over 14 days is shown for knock-in mice (gray) and their wild-type littermates (black).

