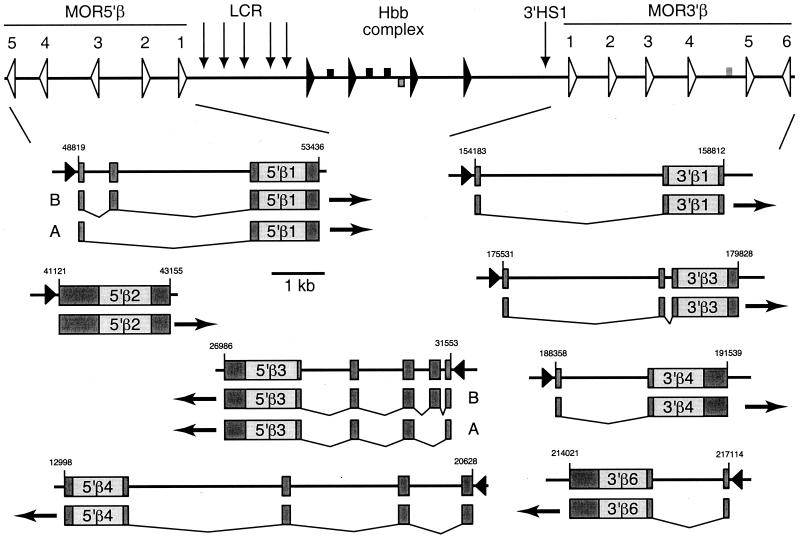
Figure 2.
Exon structures and alternative splicing of ORGs. The results of the 5′ RACE analysis are summarized. For each gene, the structure is shown on one line, with darker noncoding regions and lighter coding regions. The presumptive promoter at the 5′ ends is shown as a triangle. The 3′ untranslated region extends to the first AATAAA or ATTAAA on the nontemplate strand; the 3′ ends were not determined experimentally. Under the line with the gene structure, the pattern of spliced exons is shown, with exons connected by bent lines. Experimentally determined alternatively spliced products are labeled A and B; all of the alternatively spliced forms have not been identified.

