
Figure 3.
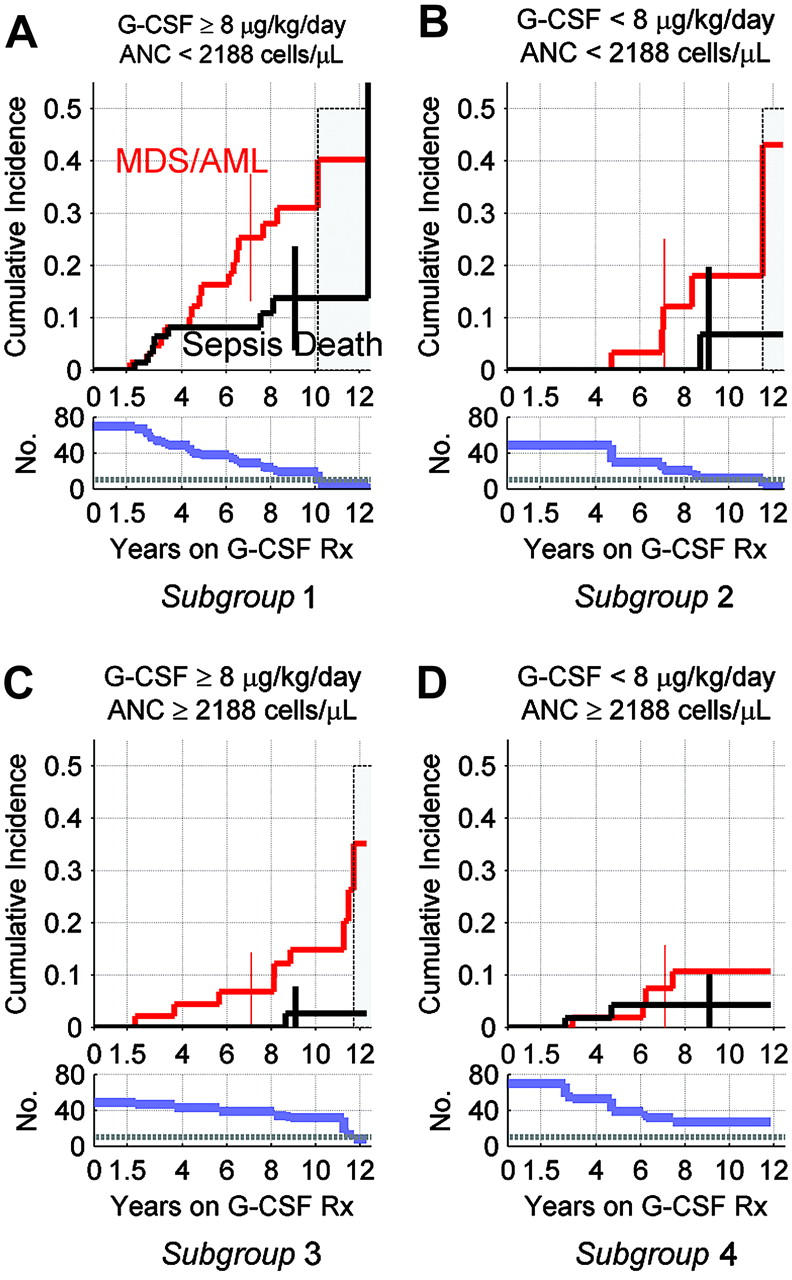
Cumulative incidence of MDS/AML and death from sepsis, by G-CSF dose at 6 months, and average ANC response over the subsequent year, in patients with SCN. Results are shown for patients in SCN Group 5 (Table 1). Top panels show cumulative incidence of MDS/AML and death from sepsis by years on G-CSF therapy; see legend to Figure 1 for details. Bottom panels show corresponding numbers of subjects still at risk and under follow-up, with horizontal reference lines at n = 10 patients. With 10 or fewer subjects, the estimated cumulative incidence curves become unstable, as indicated by gray shaded areas in top panels. Error bars in top panels show 95% confidence limits at years 7 (MDS/AML) and 9 (deaths from sepsis). (A) Cumulative incidence in subjects with mean ANC less than 2.188 × 10⁹/L (2188/μL) cells during the 6- to 18-month follow-up period on G-CSF at 6 month at 8 μg/kg/d or more. (B) Cumulative incidence in subjects with ANC less than 2.188 × 10⁹/L (2188/μL) cells on G-CSF of less than 8 μg/kg/d. (C) Cumulative incidence in subjects with ANC of 2.188 × 10⁹/L (2188/μL) cells or more on G-CSF of 8 μg/kg/d or more. (D) Cumulative incidence in subjects with ANC of 2.188 × 10⁹/L (2188/μL) cells or more on G-CSF of less than 8 μg/kg/d.