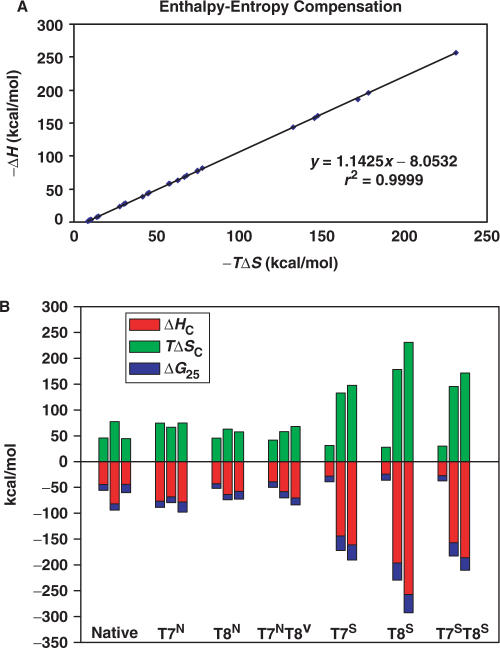
Figure 4.
(A) Enthalpy–entropy compensation plot for the ODNs in Figure 2. (B) Bar plot of ΔHC, TΔSc and ΔG25. Each bar shows the comparison of the three thermodynamic parameters. The three bars in each cluster represent (from left to right) the data for the labeled ODN in 0.1, 0.5 and 1.0 M Na+

