
Figure 5.
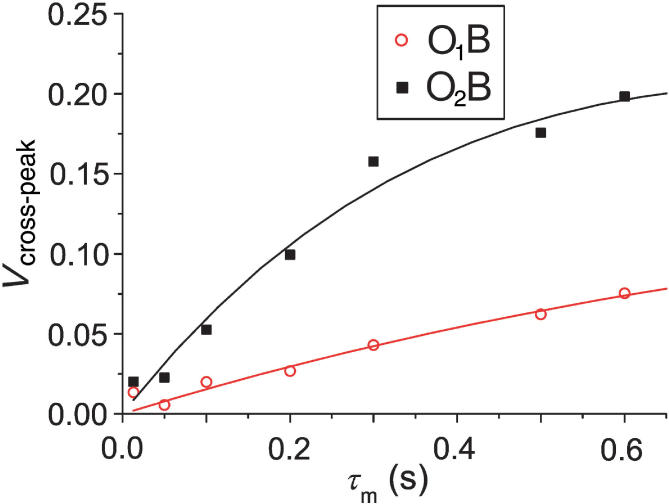
Relative volumes of O1B (red open circles) and O2B (black filled squares) cross-peaks as a function of mixing time (τm) at 293 K. Curves represent the best fit of the experimental data to Equation (2).
Official websites use .gov
A
.gov website belongs to an official
government organization in the United States.
Secure .gov websites use HTTPS
A lock (
) or https:// means you've safely
connected to the .gov website. Share sensitive
information only on official, secure websites.
Relative volumes of O1B (red open circles) and O2B (black filled squares) cross-peaks as a function of mixing time (τm) at 293 K. Curves represent the best fit of the experimental data to Equation (2).