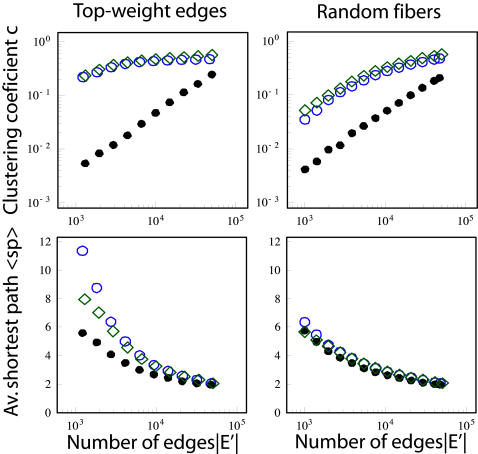
Figure 5. Average shortest path <sp> and clustering coefficient c as a function of the number of edges in the brain graph |E'|.
The edges are chosen from the set of all edges E either giving the priority to the edges with high weights (“Top-weight edges”, left column), or based on a random subset of fibers (“Random fibers”, right column). As a reference we take a random graph with the same number of nodes and edges, and the same degree distribution. Color code: subject 1 (blue circles), subject 2 (green diamonds), random graph reference (black filled circles). The results are averaged over 10 realizations of the “random fibers” filtering and random graphs; the confidence intervals (not shown) are comparable with the symbol size.

