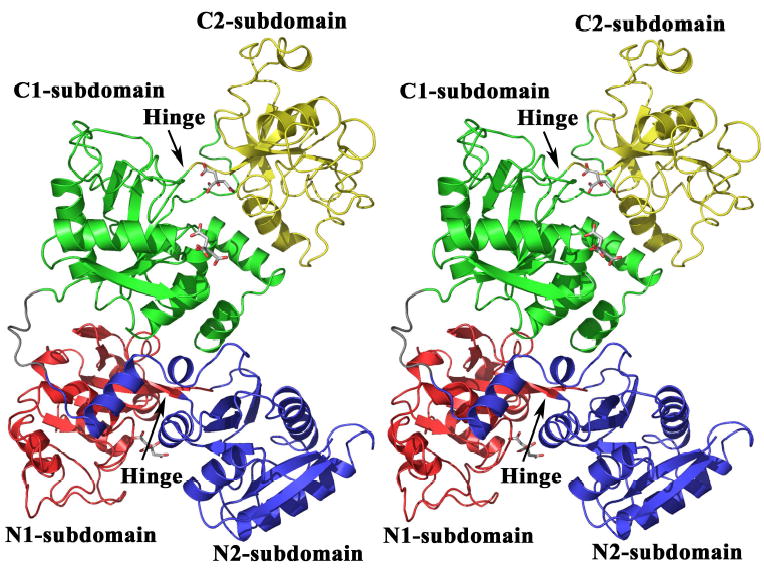
Fig. 1.

Stereo image of the crystal structure of apo-hTF with subdomain N1 in red, N2 in blue, C1 in green and C2 in yellow. The linker region between the lobes is colored grey and the hinge between the N1- and N2- subdomains and the C1- and C2-subdomains is identified. Four of the citrate molecules associated with apo-hTF are shown by stick representation. All figures were made with PYMOL (89).
