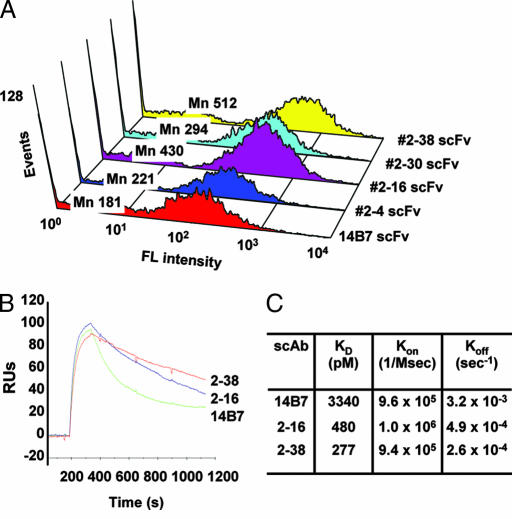
Fig. 2.
Analysis of anti-PA antibody fragments selected by APEx two-hybrid. (A) Flow cytometry histogram depicting the mean fluorescence (Mn) of E. coli expressing anti-PA scFvs and labeled with anti-FLAG-FITC. (B) BIACore analysis of anti-PA scAb binding to PA. (C) Rate constants for antigen binding and dissociation acquired by surface plasmon resonance (SPR).

