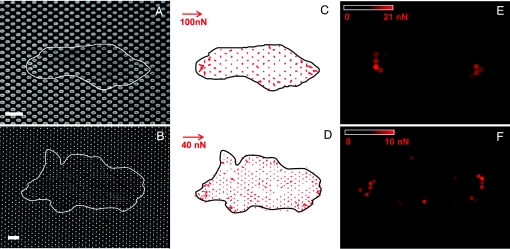
Fig. 4.
Traction force experiments. (A) Fluorescence microscopy image of the tops of the micropillars coated and labeled with fibronectin-Cy3. (B) Transmission microscopy image of a cell island lying on the micropillars. The positions of the islands are outlined in white. (Scale bars: 10 μm.) (C and D) Maps of the instantaneous traction forces detected within the boundary of the islands at times corresponding to A (C) and B (D) on substrates with two different rigidities: k(θ = 0°) = 56 and 19 nN/μm, respectively. (E and F) Color maps of the average magnitude of the forces applied over a 1-h period by the cellular islands shown in A (E) and B (F), calculated from time-lapse sequences.

