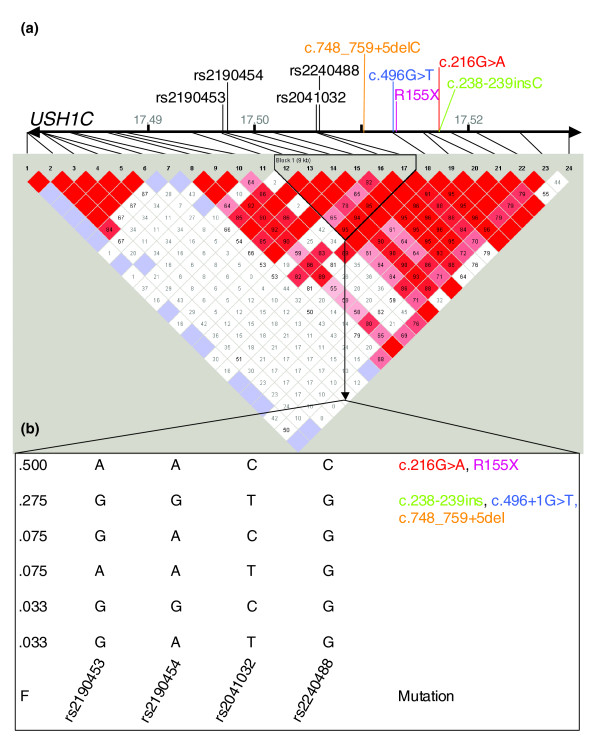
Figure 2.

Haplotype structure of the USH1C gene locus in Europeans. (a) Structure of the USH1C gene with relative positions of mutations identified in this study and SNPs typed by the HapMap project [30]. Rate (D') of linkage disequilibrium (LD; visualized by haploview program) is represented by different colors (highest rate of LD in dark red and lower LD in light red/white). The marked block defines potential haplotypes between selected SNPs. Note that the orientation of the graphic is opposite to Figure 1b and that SNP alleles are given in reverse complement. (b) Potential haplotypes in the European population (CEU) for four selected SNPs that have been genotyped in our study. F: putative frequency of these haplotypes in CEU as determined in the HapMap project. The 'Acadian allele', c.216G>A, and p.R155X are both located on the most prevalent haplotype predicted to account for 50% of haplotypes. c.238-239insC, c.496+1G>T and c.748_759+5del are located on the second most common haplotype.
