
Figure 1.
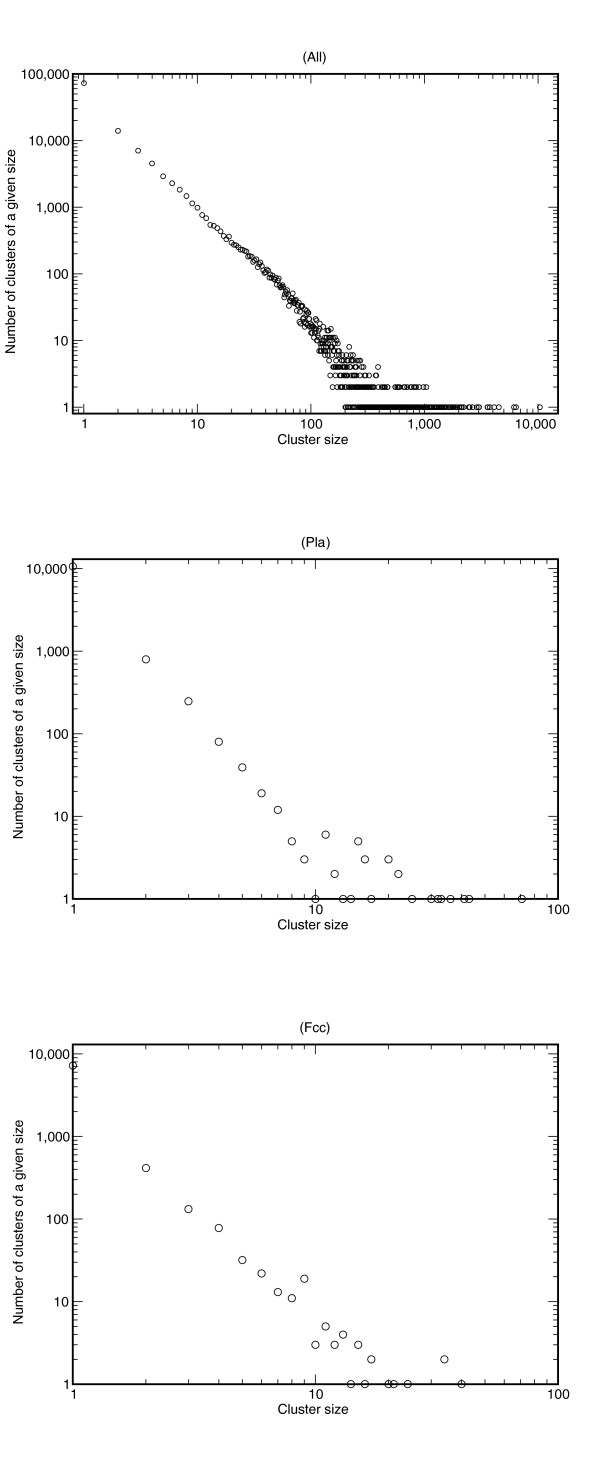
Distribution of cluster sizes. The number of clusters on the y-axis versus the cluster size (number of reads) on the x-axis exhibit a power law-like region. The distribution marked 'All' indicates the cluster size distribution for the entire dataset, whereas the other distributions are examples from specific libraries: 'Pla' (placenta, normalized) and 'Fcc' (cerebellum F100 days).