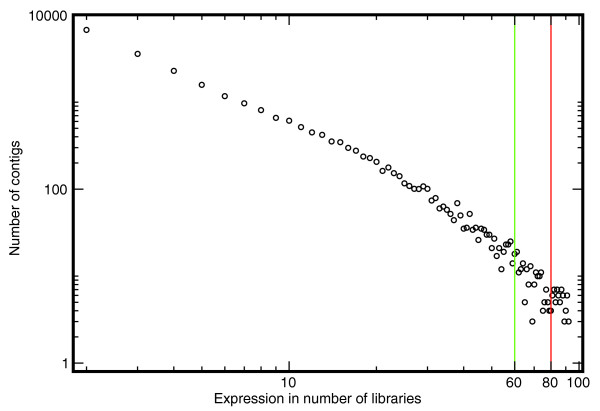
Figure 3.

Distribution of cluster coverage of cDNA libraries. The values on the x-axis indicate the number of libraries for which there is at least one expressed sequence tag (EST) read present. The corresponding value on the y-axis shows the number of conreads for a given number of libraries. The vertical lines at 60 and 80 indicate cut-offs for potential housekeeping genes. The data indicate the presence of power law-like behavior. The data also show that we can only expect a small portion of the clusters to be composed of reads from many libraries.
