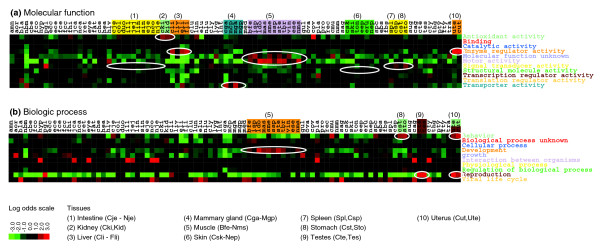
Figure 5.

Gene Ontology content of cDNA libraries and tissues. A heat map of the log odds values (in bits) for each library, found by comparing the observed fraction of the Gene Ontology top level categories of (a) 'molecular function' and (b) 'biological process' with the respective averages. Gene Ontology categories were taken from corresponding M0 to M3 BLAST matches to UniProt. The libraries are grouped by their corresponding tissues, and the coloring indicates the category where we find higher expression than by chance. Only the relevant tissues are indicated by numbers and listed by their range of cDNA library names.
