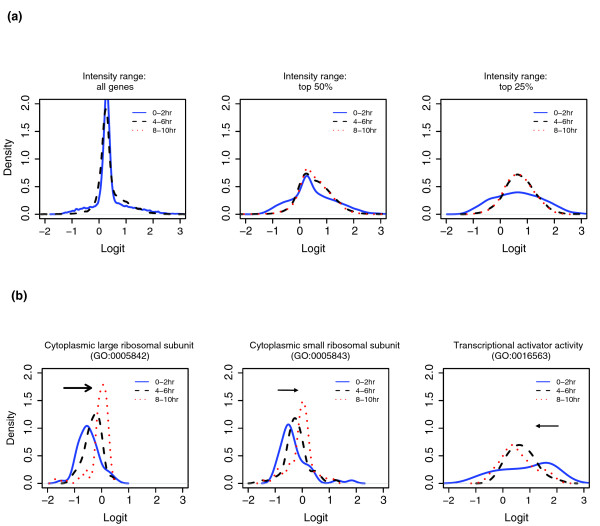
Figure 6.

Comparison of polysomal association between 0-2 hour, 4-6 hour and 8-10 hour old embryos. (a) Smoothed histograms (density plots) of Logits for individual transcript species from 0-2 hour, 4-6 hour and 8-10 hour old embryos were determined. x-axis, Logit, defined as log {percent(6-12)/percent(1-5)}; y-axis, density of Logit. The left panel includes all the probe sets, the middle panel includes the probe sets with the top 50% signal intensity and the right panel includes only the probe sets with the top 25% intensity. (b) Smoothed histograms (density plots) of Logits of the genes encoding cytoplasmic large ribosomal proteins (GO0005842, 56 genes, left), cytoplasmic small ribosomal proteins (GO0005943, 48 genes, middle) and transcription activator (GO0016563, 35 genes, right). The arrows point in the direction of development.
