
Figure 1.
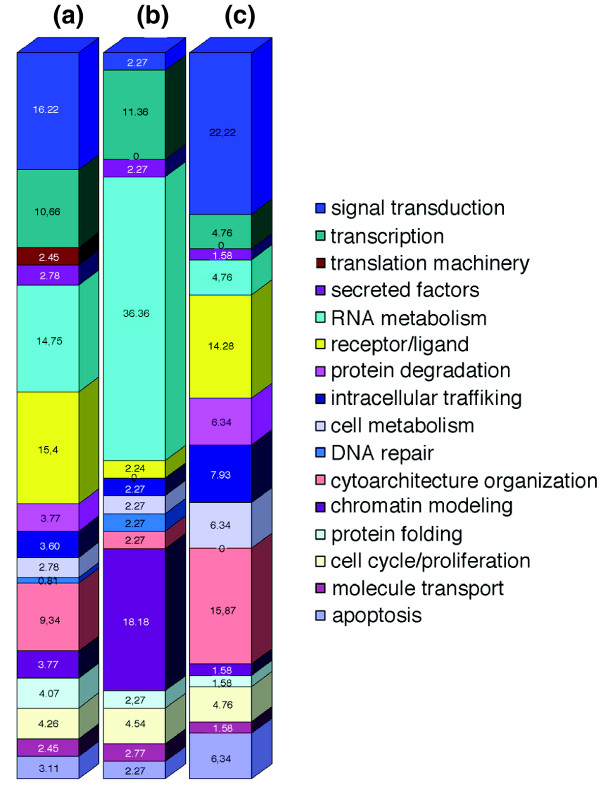
Graphical representation of the distribution (percentage) of genes by functional category. (a) The Dj600 chip, (b) genes that are downregulated as a consequence of high-dose X-ray treatment, and (c) gene set that is upregulated as a consequence of low-dose X-ray treatment.