
Figure 2.
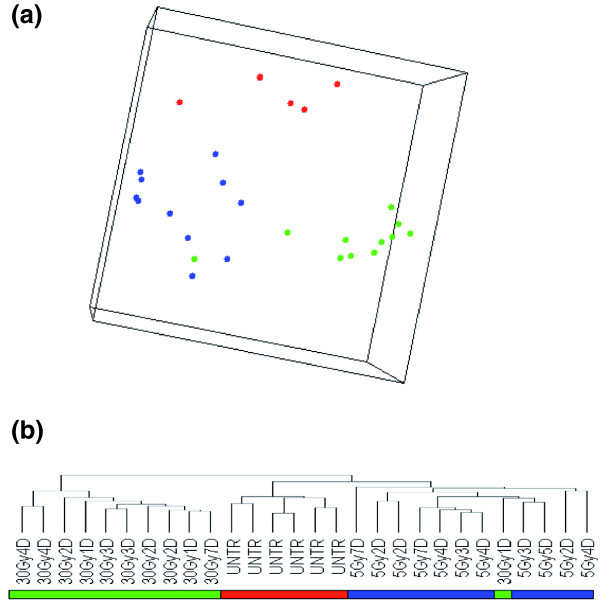
Unsupervised comparison of X-ray irradiated and control samples. (a) Multidimensional scaling analysis of the filtered 583 gene dataset (5 Gy samples: blue circles; 30 Gy samples: green circles; untreated samples: red circles). (b) Dendrogram of hierarchical clustering of all samples using centered correlation and average linkage based on the complete filtered dataset, as described in Results. The three classes of samples are indicated by the blue (5 Gy), green (30 Gy), and red (untreated) horizontal bars.