
Figure 4.
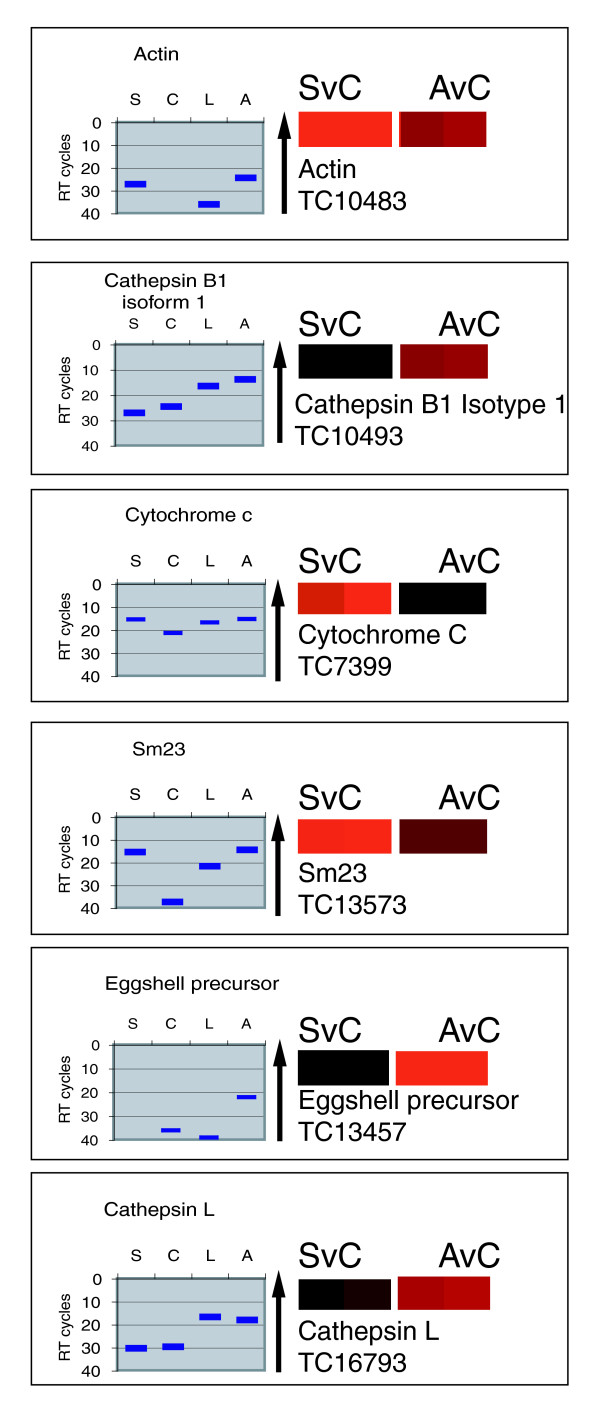
Real time PCR analysis of select transcripts across four developmental stages: sporocysts (S), cercariae (C), schistosomula (L), and adult worms (A). The upward arrow indicates transcript level where fewer RT cycles are indicative of an increase in transcripts relative to a cytochrome c internal control. The microarray ratio of sporocyst to cercaria (SvC) and adult to cercaria (AvC) is designated 'fold change' and is in the same format as Figure 2. Cathepsin L numbers are from type II analysis.