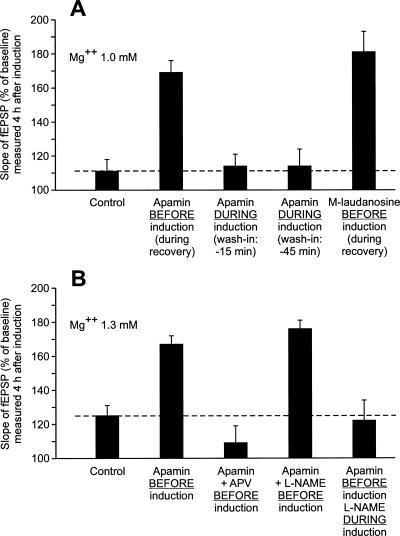
Figure 11.
Summary bar graph gathering the results of experiments carried out to demonstrate that the effect of apamin on LTP was metaplastic (A) and to try to—at least partially—elucidate the mechanisms of this action (B). (A) This set of experiments was carried out using aCSF containing Mg2+ 1mM. The amplitude (±SEM) of the increase in the slope of fEPSP was measured 4 h after LTP induction. (B) In this second set of experiments, the concentration of Mg2+ was 1.3 mM and the measurements were made 3 h after LTP induction.

