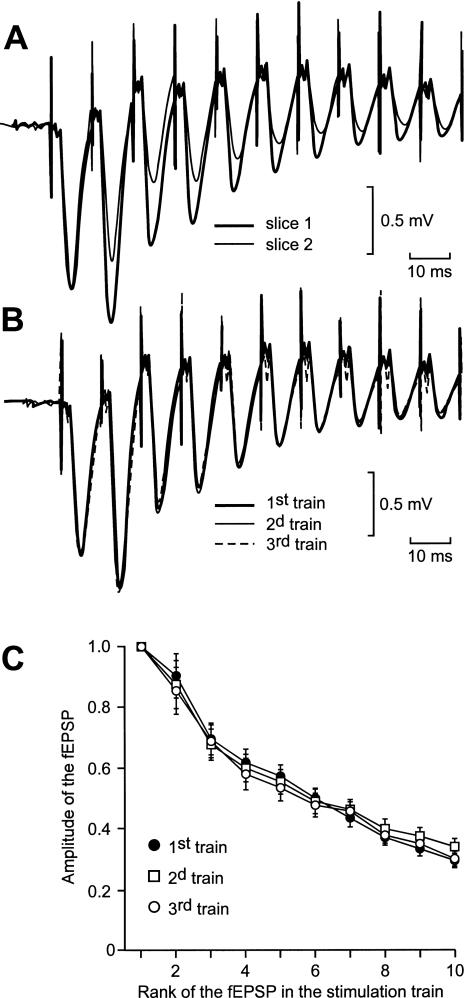
Figure 4.
The profile of the global depolarization induced by an HFS train varied from one slice to another (A) but not when the stimulus was delivered thrice at 30-min intervals on the same slice (B,C). (A) Superimposition of the first 10 fEPSPs of two series of fEPSPs recorded in two distinct slices in response to the delivery of one train of HFS. The intensity was adjusted so that the amplitudes of the first fEPSP were the same in slice number 1 (thick trace) as in slice number 2 (thin trace). (B) Superimposition of the global depolarizations induced in a same slice by three HFS trains separated by 30 min. The intensity of stimulation was adjusted to obtain the same amplitude for the first fEPSP in each of the three global depolarizations. (C) In each slice from a group of 10, the amplitude of each of the first 10 fEPSPs elicited by three HFS trains at 30-min intervals was measured. The means ± SEM of the measurements were plotted in function of the rank of the corresponding fEPSP in the series.

