Figure 2.
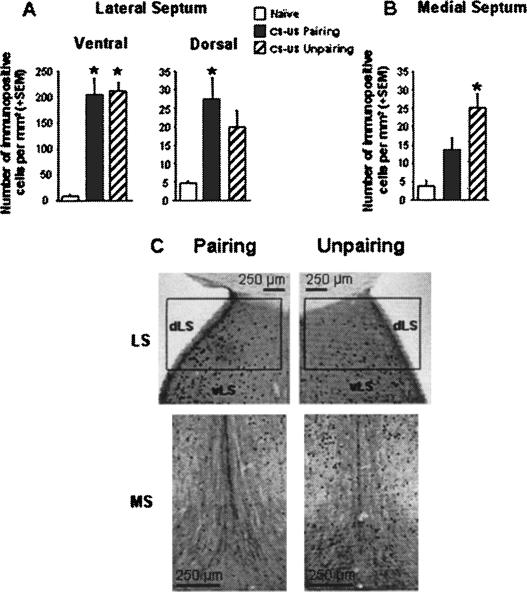
Number of c-Fos-immunopositive cells per square millimeter (mean + SEM) in the ventral LS (A, left), the dorsal LS (A, right), and the MS (B) in mice submitted to either a CS-US pairing (n = 8) or unpairing (n = 8) conditioning procedure and in naive animals (n = 7). (C) Representative photomicrographs depicting c-Fos expression within the dorsal, ventral LS (dLS, vLS) and MS in mice submitted to the CS-US pairing or unpairing procedure. (*) Significantly different from the naive group, P < 0.05.

