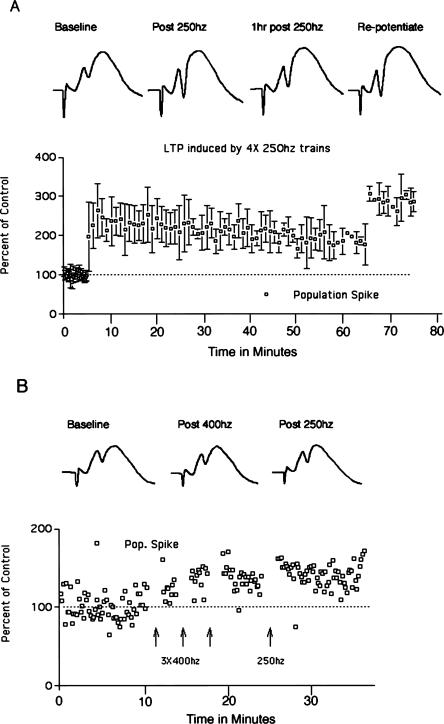
Figure 6.
Time course of LTP induced in rats by 250 Hz stimulation and blockade of induction by NMDA receptor antagonists. (A) Perforant path LTP induced by 250 Hz stimulation. Traces illustrate positive-going population EPSPs and population spikes recorded by a micropipette positioned in the cell body layer of the dorsal blade of the dentate gyrus. The graph illustrates average population-spike amplitude (± SD) as a percent of baseline before and after 250 Hz stimulation. After testing for 1 h, another set of three 250 Hz trains was delivered (repotentiate), which produced additional LTP. (B) LTP is blocked when the micropipette recording electrode contains MK801 (10 mg/mL). Traces illustrate positive-going population EPSPs and population spikes recorded by a micropipette positioned in the cell body layer of the dorsal blade of the dentate gyrus. In this experiment, three bouts of 400 Hz stimulation were delivered, and then three bouts of 250 Hz stimulation. Neither produced the LTP that is otherwise seen.

