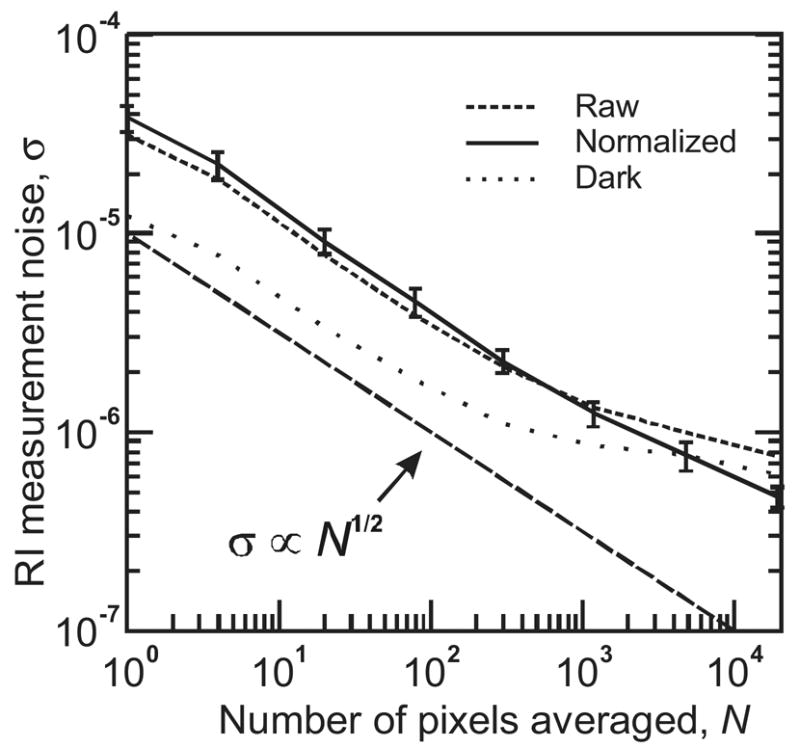
Figure 4.

Imager noise characterization. Root-mean-square refractive index noise values were calculated from measurements of RI test solutions. Error bars indicate the standard deviation of calculated noise values across 32 measurements (eight sample regions, four solutions). Calculation was then repeated for subsets of each sample region, ranging from 160 × 120 pixels down to 1x1 pixel. Shown for comparison are the equivalent RI noise measured with no illumination (detector dark noise), and a line showing the expected inverse-square-root relationship between the number of pixels averaged and RI measurement noise.
