
Figure 3.
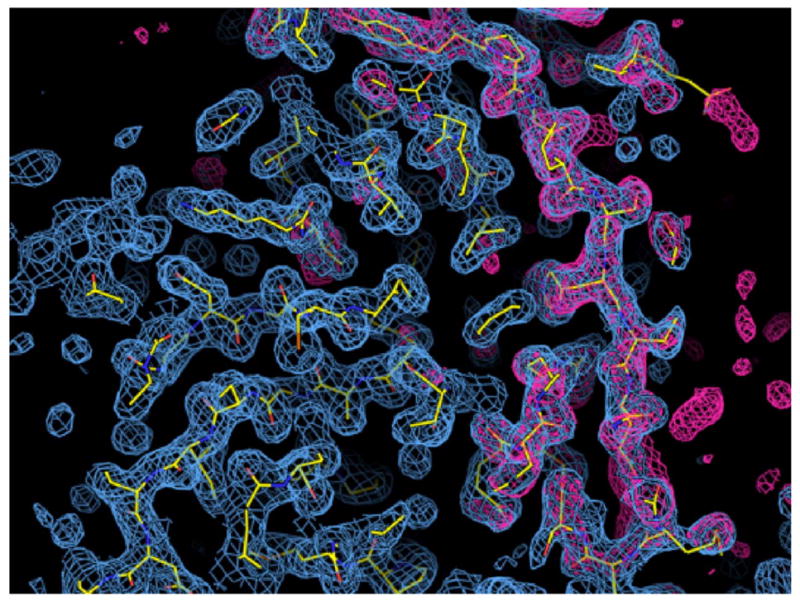
Electron density for the crystal structure of a hyper-cleavable monomeric fragment of cI containing the hinge region. The structure of the cI101-229DM K192A construct is shown superimposed on the 2Fo-Fc electron density map (blue cage) contoured at 1 sigma and calculated at 1.8 Å resolution. The red cage shows the Fo-Fc map contoured at +3 sigma after simulated annealing refinement with the atoms of the hinge region (residues 101-132) omitted. The atoms in the model are colored yellow for carbon, blue for nitrogen, and red for oxygen.