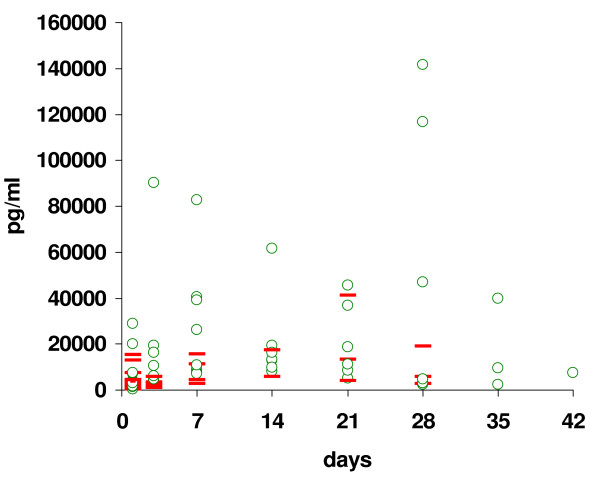
Figure 3.
Tracheal aspirate IL-8 values. Demonstrates the tracheal aspirate values that were collected at enrollment into the study (day 0) and then study days 3, 7, 14, 21, 28, 35 and 42. The ○ represents values for the control group, and the - represents values for the azithromycin group. There are numerous missing values due infants being extubated, and therefore not being able to collect tracheal aspirates. The p-value is not significant between groups.

