
Figure 1.
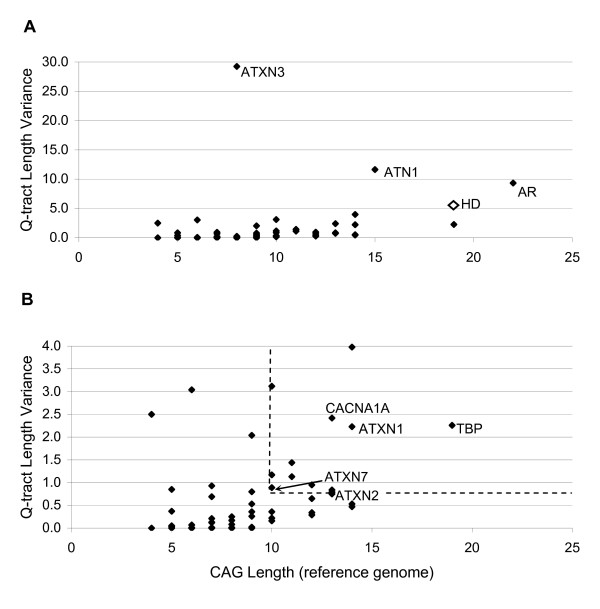
Relationship between length of longest uninterrupted CAG-tract and Q-tract length variance. (A) All targets. HD Q-tract length variance from Andres et al. [26]. Correlation = 0.62, not including ATXN3. (B) Higher resolution view of targets with Q-tract length variance < 4.0. Dashed lines at 10 CAG and 0.79 variance represent the cutoff for identifying candidate genes for polyglutamine expansion disorders. See text for list of genes falling in this area.