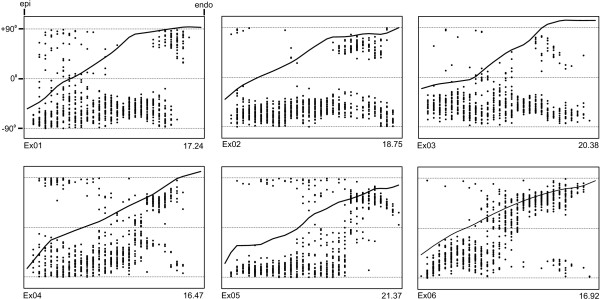
Figure 4.
Model geometries from heart blocks Ex01-Ex06. Each graph shows the transition in fibre angle through the heart wall, from epicardium (left) to endocardium (right), plotted between -90° to +90° (upper and lower horizontal dashed lines respectively). The transmural depth of each tissue block is recorded in mm at the bottom right of each graph.

