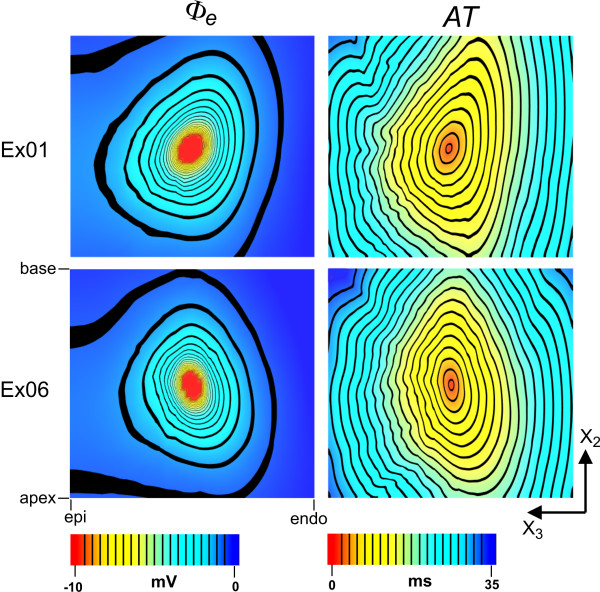
Figure 5.
Example simulations. Examples of simulations using model volumes Ex01 (upper panels) and Ex06 (lower panels). Extracellular potential fields (Φe) generated by focal current application at the tissue centres are shown in the left panels. Activation time (AT) fields derived from wavefront propagation from the site of current injection are shown in the right panels. The epi (epicardium) to endo (endocardium) distance is ~17 mm for both models.

