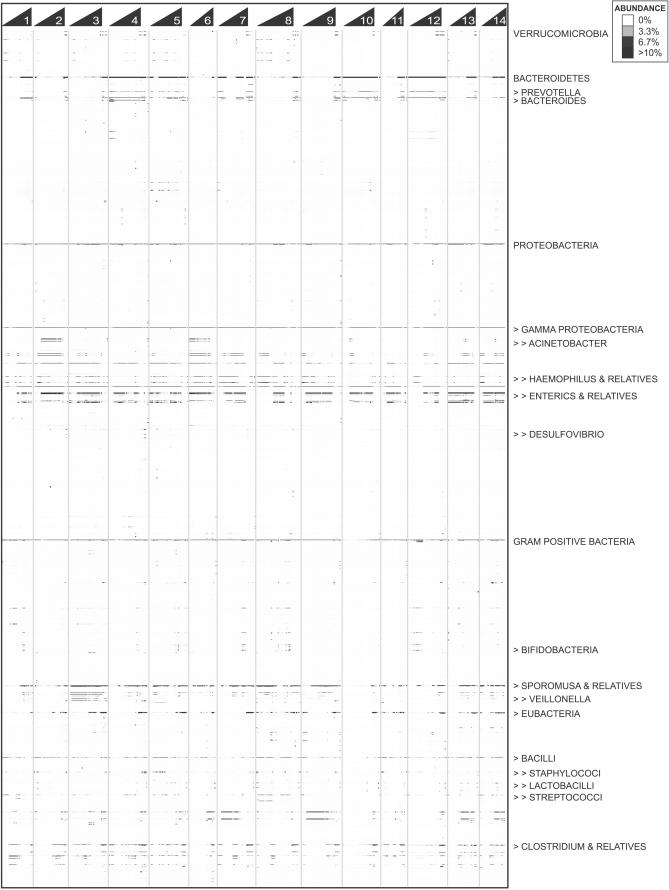
Figure 3. Overview of Microbial Community Profiles of All Samples.
Each column (n = 430) represents one biological sample and each row (n = 2,149) represents one taxonomic group or species. Samples are organized in temporal order, beginning with birth at left and any maternal- or other family-derived samples at the right of each time course. Wedges above columns are numbered according to baby identifier. Rows (taxa) are sorted by their numerical codes so that subgroups of a given group lie directly below the more general group (e.g., 2.15, then 2.15.1, then 2.15.1.1). The symbols “>” and “> >” are added to the names of labeled taxonomic groups that are subgroups, at level 3 or level 4, respectively, of a labeled level 2 taxonomic group. Increasing darkness of the grayscale corresponds to higher estimated relative abundance.

