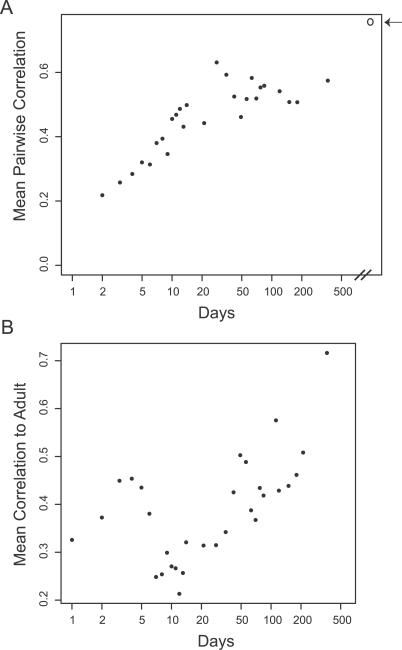
Figure 6. Temporal Patterns in Average Pairwise Similarity of Infant Stool Microbiota Profiles.
(A) Similarity between infants over time. For each time point for which at least six babies were profiled, we calculated the mean pairwise Pearson correlation between the level 4 taxonomic profiles of all babies at that time point. The mean pairwise Pearson correlation between these profiles in 18 adult participants in this study (nine males and nine females) is also shown (open circle indicated by the arrow).
(B) Progression towards adult-like flora over time. For each time point for which at least four babies were profiled, we calculated the mean Pearson correlation between the level 4 taxonomic profiles of all babies at that time point and a “generic adult” profile. The generic adult profile is the centroid of 18 (nine male and nine female) adults (parents in this study).

