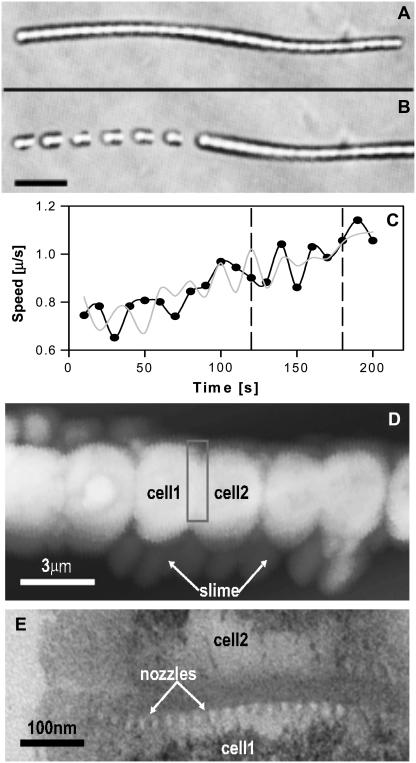
FIGURE 1.
A 120-μm-long hormogonium (A) embedded in a 1% agar solution and (B) gliding rightward at 0.9 μm/s (composite image with snapshots at 10-s intervals; 20-μm scale bar). (C) Velocity versus time for its left (back) end (dark trace) and right (front) end (light trace). Images in B were taken from between the dashed lines. (D) AFM of slime being ejected from a hormogonium (3-μm scale bar). (E) The bright dots in the horizontal band are slime-ejection nozzles on a septum between two cells (TEM; 100-nm scale bar, part E taken as if box in part D were enlarged and rotated 90°).

