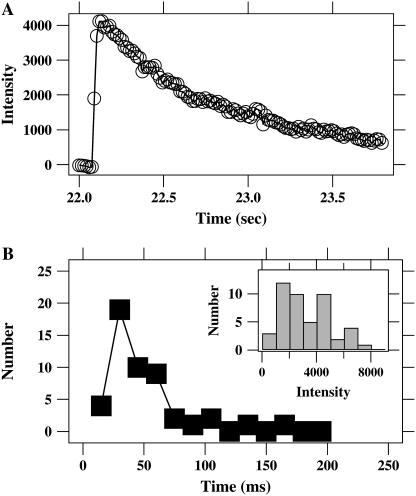
FIGURE 4.
Measurements of the dynamics of lipid mixing between individual virus particles and a supported bilayer, at 15 ms/frame. (A) The intensity versus time for a single R18-labeled Sindbis virus particle on a supported lipid bilayer (liver extract). The particle binds the supported bilayer, then hemifuses/fuses in less than two 15-ms time steps. (B) A histogram of dequenching times (10–90%) for 49 of 51 fusion events taken over 10 movies from five slides (two were >200 ms). Most events occur in two time steps. Some events that are fast enough to be completed within one time bin will be counted in the group requiring two time bins, because those events may begin toward the end of one time bin and finish during the next bin. An exponential fit omitting the first time bin yields a time constant of 28 ms. The histogram in the inset displays the maximum intensity after dequenching for the fusion events analyzed in B. The distribution in the inset shows that the events used to measure the initial dequenching rate did not vary by more than a factor of 3–4 in final intensity, although there is some heterogeneity in the efficiency of particle labeling.

