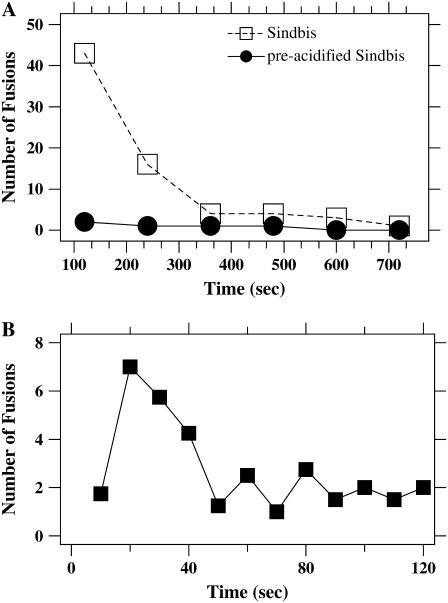
FIGURE 5.
Time course of single particle-bilayer experiments. (A) Each of the open symbols (dashed line) corresponds to the total number of hemifusions/fusions observed in the preceding 2-min interval for Sindbis virus interacting with supported lipid bilayers (liver extract) at pH 4.6. Virus was introduced into the flow cell at time zero. The solid line (solid symbols) reports an identical measurement of virus that was exposed to pH 4.6 for 6 min before the injection into the flow cell. Sindbis loses its fusion capacity quickly after exposure to acidic conditions. (B) Results from a different experiment at pH 5.5 (without acid exposure to the virus before injection to the flow cell) binned into events within the preceding 10 s illustrates that the majority of lipid mixing events takes place within the first minute of the experiment. The large circles in Fig. 1 plot this same data as the cumulative number of hemifusion/fusions as a function of time.

