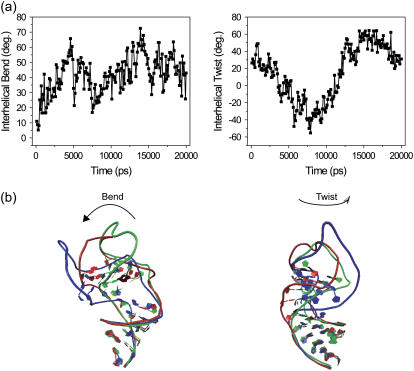
FIGURE 2.
The interhelical bend and twist (a) as a function of time. Also shown are three snapshots taken from the 20-ns trajectory showing the structural variation in the bend and twist (b). The representative structures have a corresponding range in the bend of 16.6–72.5 and in the twist of −41.4–24.4.

