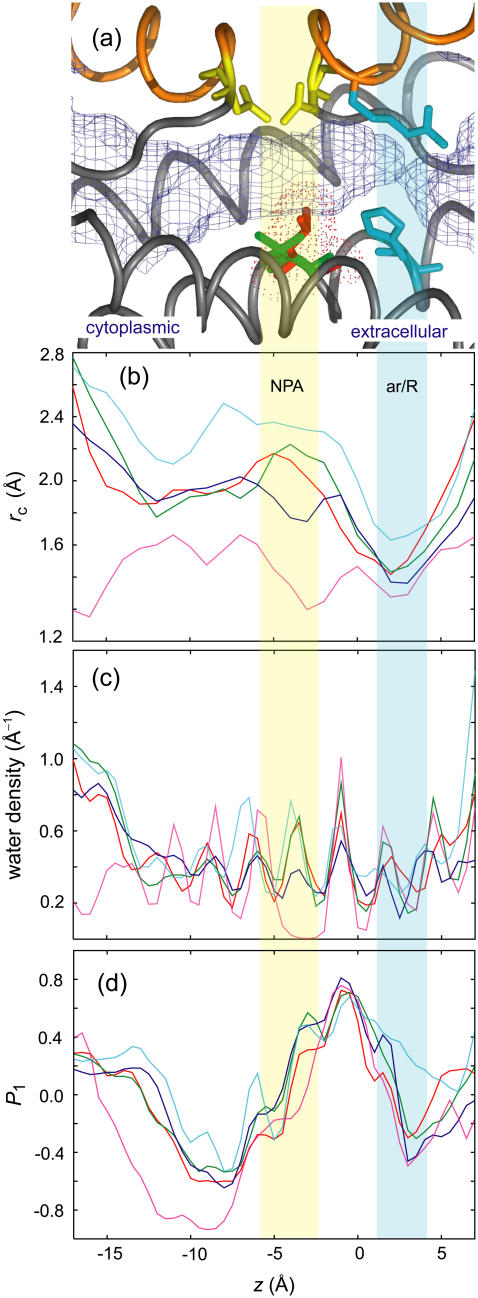
FIGURE 2.
(a) The channel region of an AQP monomer drawn using the coordinates of AQP1. The pore is represented by light-blue meshes. The NPA motifs and the ar/R region are drawn in yellow and cyan sticks, respectively. Val178 (AQP1) and Leu170 (AqpZ) are indicated by green and red sticks, respectively. The hemihelices (HB and HE) are colored orange. The z-axis is aligned to the bilayer normal with the extracellular side on the right. (b) Channel radius rc(z), AQP1 (red), AQP4 (green), AqpZ (blue), GlpF (cyan), and AQP0 (magenta), calculated by the method proposed by Smart et al. (58), which uses Monte Carlo simulated annealing to search the vacant area with a probe sphere in the x-y plane for a given z value. The radius profiles are averages over the eight monomers in the two independent 5-ns simulations. The NPA motifs and ar/R region are indicated by semitransparent yellow and cyan areas, respectively. The horizontal axis represents the z-axis. (c) Number density of channel waters. (d) Orientation of channel waters represented by the order parameter P1(z) = 〈cosθ〉, where θ is the angle between the dipole moment of water and the z-axis.

