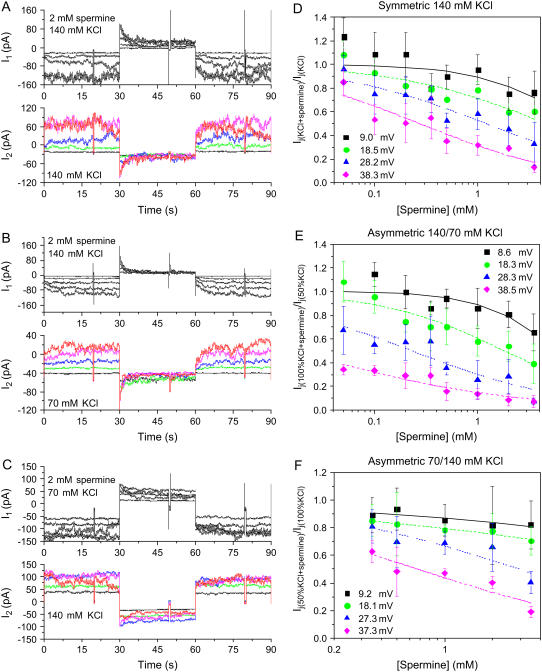
FIGURE 2.
Double whole-cell current (I1 and I2) recordings and spermine dose-response curves under different [KCl] conditions. I1 and I2 recordings for the control symmetric 140 mM KCl (A), asymmetric 70/140 mM trans/cis KCl (B), or asymmetric 140/70 mM trans/cis KCl (C) conditions were obtained with 2 mM spermine added unilaterally to cell 1. Junctional current (Ij = −ΔI2 measured from baseline Vj = 0 mV steps) was reduced in a time-dependent manner only when a positive Vj pulse (middle 30-s pulse) was applied to cell 1. Each colored current trace represents a ±10 mV increase in Vj (black < green < blue < magenta < red). The Cx40 spermine inhibition dose-response curves were calculated from the mean (±SD) fractional Ij(KCl + spermine)/Ij(KCl) values for the symmetric 140 mM KCl (D), asymmetric 140/70 mM cis/trans KCl (E), or asymmetric 70/140 cis/trans mM KCl (F) conditions. The solid lines represent the Hill equation (Eq. 2) fits for each curve. The effective Kd values are listed in Table 2 (see text and Supplementary Material, Figs. S1 and S2 for more details).

