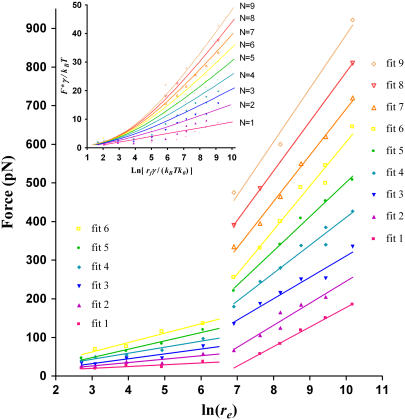
FIGURE 4.
Plots of the most probable unbinding forces F* versus the natural logarithm of the experimental loading rate on the biochemical bonds. Due to multiplicity of F* at one loading rate, we have drawn multiple linear regression lines for multiple populations of forces (see text for details). Six fits were present in the low loading rate region (<665 pN/s); whereas nine fits were found in the high loading rate region (>665 pN/s). Inset indicates fitting lines (normalized coordinates) of the normalized distribution of F* versus normalized loading rates, according to the Williams model of rupture force of multiple attachments loaded in parallel using a γ = 0.19 nm and k0 = 0.13 s−1 (49).

