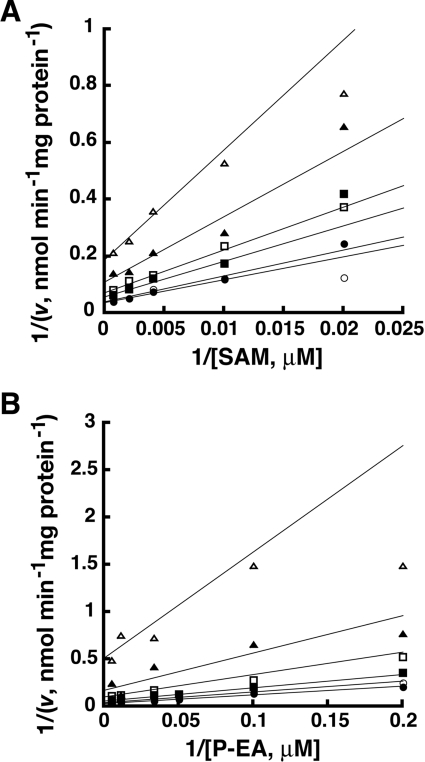
Figure 4. Initial velocity variation of PMT-1 substrates.
Experimental data are indicated by the symbols in the double reciprocal plots of the substrate variation experiments. The lines shown represent the global fit of all data to the equation for a random sequential Bi Bi mechanism. Assays were performed as described in the Experimental section. (A) Double reciprocal plot of 1/v versus 1/[SAM] at 5, 10, 20, 30, 90 and 200 μM phosphoethanolamine (top to bottom). (B) Double reciprocal plot of 1/v versus 1/[phosphoethanolamine (P-EA)] at 15, 50, 100, 250, 500 and 2500 μM SAM (top to bottom).

