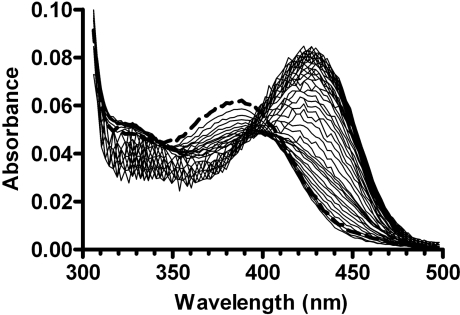
Figure 3. Spectral changes observed upon stopped-flow mixing of 120 μM apoE and 20 μM PLP.
Only spectra taken at 20 ms intervals (after 9 ms from stop of flow) with intense light and at 64 ms intervals with low-intensity light are shown for clarity. The sum of the spectra of PLP and apoE obtained after mixing with buffer is shown as a thick broken line. Conditions were as in Figure 1.

