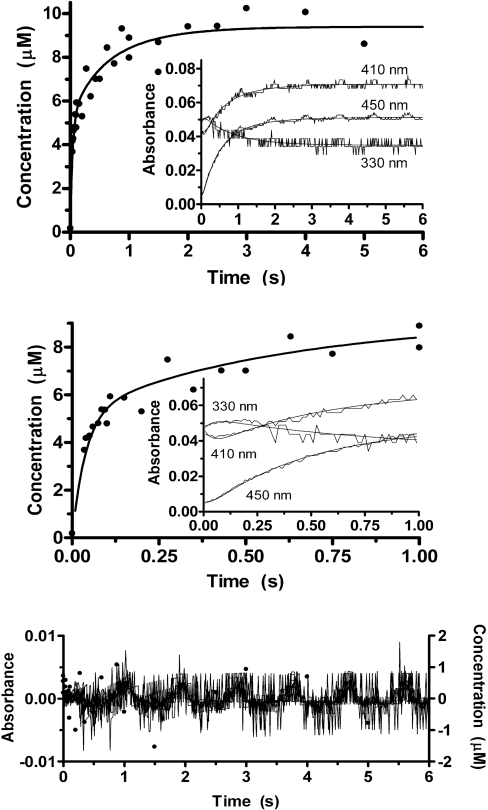
Figure 5. Representative results of the global fit of absorbance changes and internal aldimine formation.
Top panel: internal aldimine formation (●) and nine kinetic traces (only three of which are shown for clarity in the inset) were fitted by least squares to differential equations corresponding to Scheme 1. Middle panel: expanded view showing the early phase of the reaction. Bottom panel: residuals of the fit relative to all nine kinetic traces and the internal aldimine formation.

