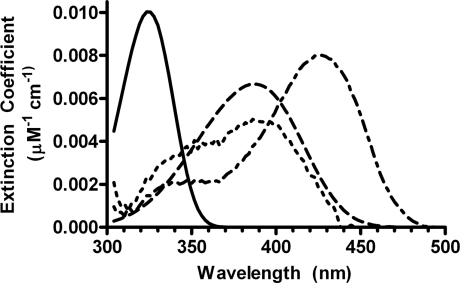
Figure 6. Absorption spectra of kinetic species in Scheme 1, as reconstructed from the estimated micromolar absorption (‘extinction’) coefficients yielded by the global fit.
Spectra: ——, apo-E•PLPHyd; –––––, apo-E•PLPAld;-----, E=PLP*;-·-·-·-, holoE.

