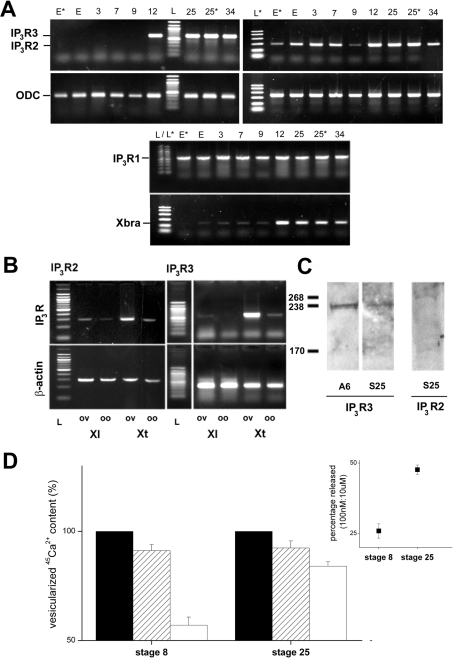
Figure 3. Expression of Xenopus Itpr subtypes.
(A) Developmental expression of Itpr1 (middle), Itpr2 (right) and Itpr3 (left) mRNA analysed by RT–PCR. mRNA was extracted from eggs (E and E*, different donor samples) and a variety of developmental stages [3, 7, 9, 12, 25, 25* (different donor sample) and 34]. Specificity of amplification from stage-specific cDNA was confirmed by sizing (L, 100 bp ladder N3231S, NEB; L*, PCR marker ladder #G3161, Promega) and sequencing. Reactions for ODC as a loading control (expected product size of 385 bp) and Xbra (expected product size of 187bp) are shown. (B) RT–PCR screening of Itpr2 and Itpr3 mRNA in ovarian tissue (‘ov’) and stage VI oocytes (‘oo’) in X. laevis (‘Xl’) and X. tropicalis (‘Xt’). Upper panels, Itpr2 and Itpr3 diagnostic primers. Lower panels, loading controls were either β-actin (Itpr2, left) or ODC (Itpr3, right). (C) Immunological identification of IP3R2 and IP3R3. Lanes were loaded with 30 μg of protein from either the Xenopus A6 kidney cell line (A6) or stage 25 embryos (S25) and probed with anti-IP3R3 or anti-IP3R2. Molecular-mass marker sizes are indicated in kDa. (D) 45Ca2+ efflux analysis of microsomes prepared from pre-MBT (stage 8, left) and tailbud-stage embryos (stage 25, right), showing the proportion of the total 45Ca2+ content (closed bars) released by submaximal (100 nM, hatched bars) and maximal concentrations of IP3 (10 μM, open bars). Data were compared only from embryos prepared from the same donor animal (n≥3 independent donors). Inset, proportion of IP3-sensitive Ca2+ store mobilized by 100 nM IP3 as a percentage of the response to 10 μM IP3 as a crude index of sensitivity.

