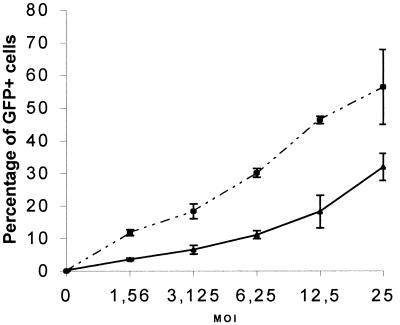
Figure 2.
Dose–response curve to Bac-CMV-GFP infection. 105 cells were infected at various mois with the vector, and FACS analysis was used to evaluate the percentage of GFP+ cells 48 h after infection. The solid line represents human embryonic telencephalic cells cultivated in basic fibroblast growth factor (undifferentiated), and the dotted line represents human embryonic telencephalic cells cultivated in 10% FCS for at least 1 week before infection (differentiated cells). For each moi, three independent infections were performed.

