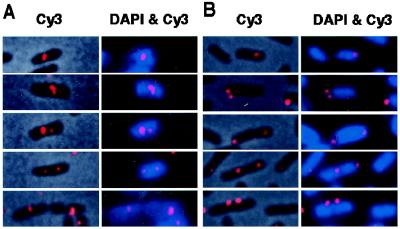
Figure 4.
Localization of fluorescent foci of the miniF plasmids, pXX762 (A) and pXX764 (B). In A and B, overlaid phase contrast and fluorescence in situ hybridization (FISH) (Cy3) images of the same field are shown (Left), and overlaid Cy3 (FISH) and 4′,6-diamidino-2-phenylindole (DNA staining) fluorescence images of the same field are shown (Right). Bar = 2 μm.

