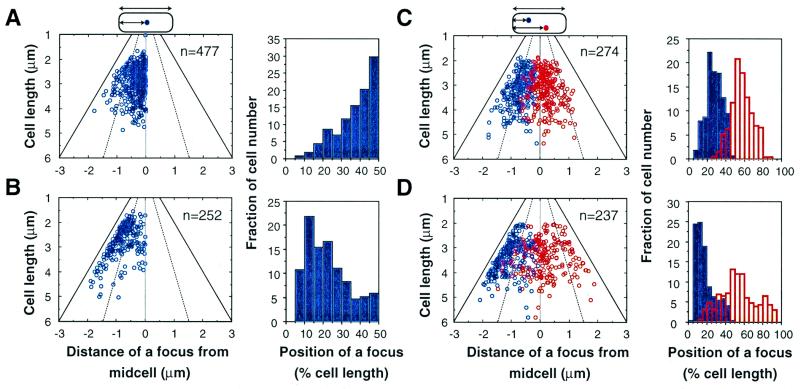
Figure 5.
Analysis of subcellular localization of the miniF plasmid with soj-spo0J-parS. Scatter diagrams and histograms of localization of fluorescent foci in cells with a single focus of pXX762 (A) or pXX764 (B). The distance of each focus from midcell was measured from the nearest cell pole to the center of the focus. Scatter diagrams and histograms of the localization of fluorescent foci in cells with two foci carrying pXX762 (C) or pXX764 (D). The focus closest to a cell pole is shown in blue. The distance of the other focus from the same pole was measured (red). The broken lines indicate the 1/4 and 3/4 positions of cell length, and the solid lines indicate the position of a cell pole. The thin lines indicate midcell.

