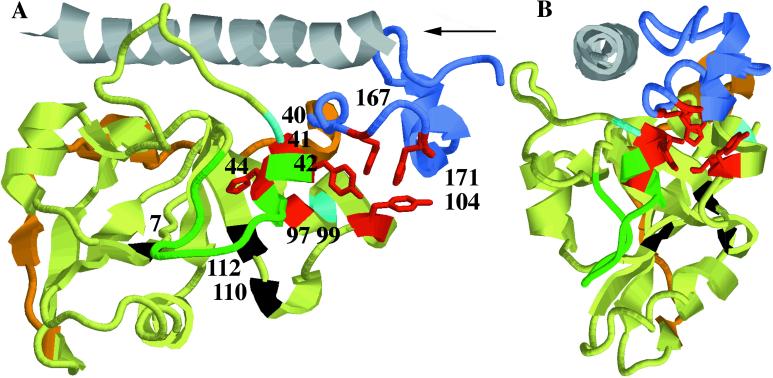
Figure 3.
Cartoon diagram of CTA1 and CTA2 showing residues proposed to interact with ARF6. Only residues 196–226 of CTA2 are shown, in gray. Subdomains of CTA1 are colored light green (globular A11, 1–132), orange (extended bridge A12, 133–161), and blue (globular hydrophobic A13, 162–192). The loop (41–56) that partially occludes the active site is shown in green. Individual residues that affected interaction of CTA1 with ARF6 are colored red, and among these the side chains of the aromatic residues are shown in stick format. Residues 40 and 99 that have only partial effects on ARF interaction are colored cyan. Residues where enzyme-inactivating substitutions (R7K, E110D + E112D) were made in parental constructs are shown in black. (A) Individual residues are identified by number. The arrow denotes the point of view for (B), down the axis of the A2 α helix.

