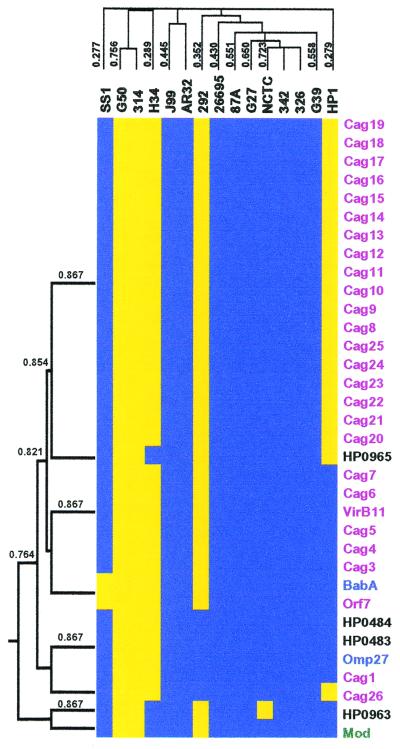
Figure 3.
Cluster analysis of PAI genes. The subset of 362 strain-specific genes was used to generate a dendogram of both the strains and the genes based on the presence or absence of genes. The strains and genes were grouped by average hierarchical clustering using the cluster program and the output displayed using the treeview program. The portion of the cluster containing the PAI genes is shown where the presence (blue) or absence (yellow) of genes is indicated. Genes within the PAI (purple) and genes with homology to OMPs (blue), restriction modification genes (green), or no homology (black) are indicated. (Left) Dendogram of genes that cocluster with the PAI genes, with the Pearson correlation coefficients. Above the cluster is the dendogram of H. pylori strains, based on all strain-specific genes, with the Pearson correlation coefficients. The entire cluster is available as Table 4, which is published as supplemental data on the PNAS web site www.pnas.org.

