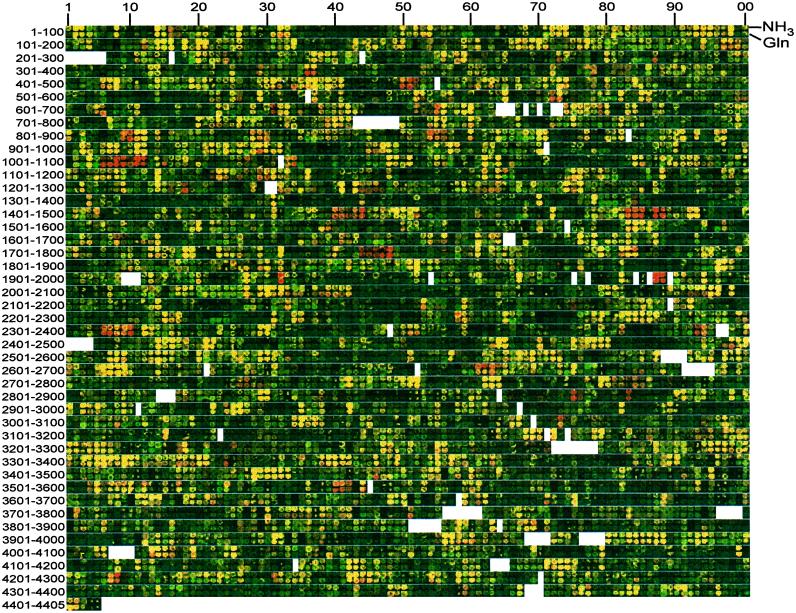
Figure 1.
Two aligned genome images. Microarrays were probed with mixtures of cDNAs from the glnL(Up) and glnG strains grown on ammonium (upper row of each pair, experiment c) or glutamine (lower row, experiment e) as nitrogen source. Spots from fluorescence scanning images of microarrays were rearranged in genome order. The b number centuries (6) are indicated to the left. Blanks represent either b numbers that do not correspond to ORFs or that no longer exist. Red spots can be seen for most operons in Table 1. For some highly expressed genes—e.g., codBA (b0336–37) in the upper row and glnA (b3870)—spots appear intense yellow rather than red because of image saturation.

