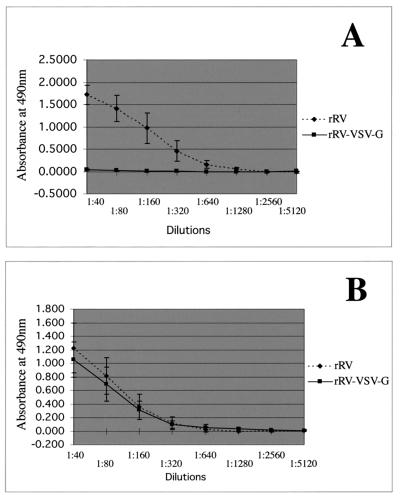
Figure 7.
ELISA analysis of mouse sera against RV RNP and RV G. Sera were collected 9 days after priming from all mice and analyzed for reactivity against RV G (A) or RV RNP (B). Sera from each mouse were run in duplicate. Graphs represent the average of 10 mice per group with the error bars representing standard deviations.

